Equipment Cost Index

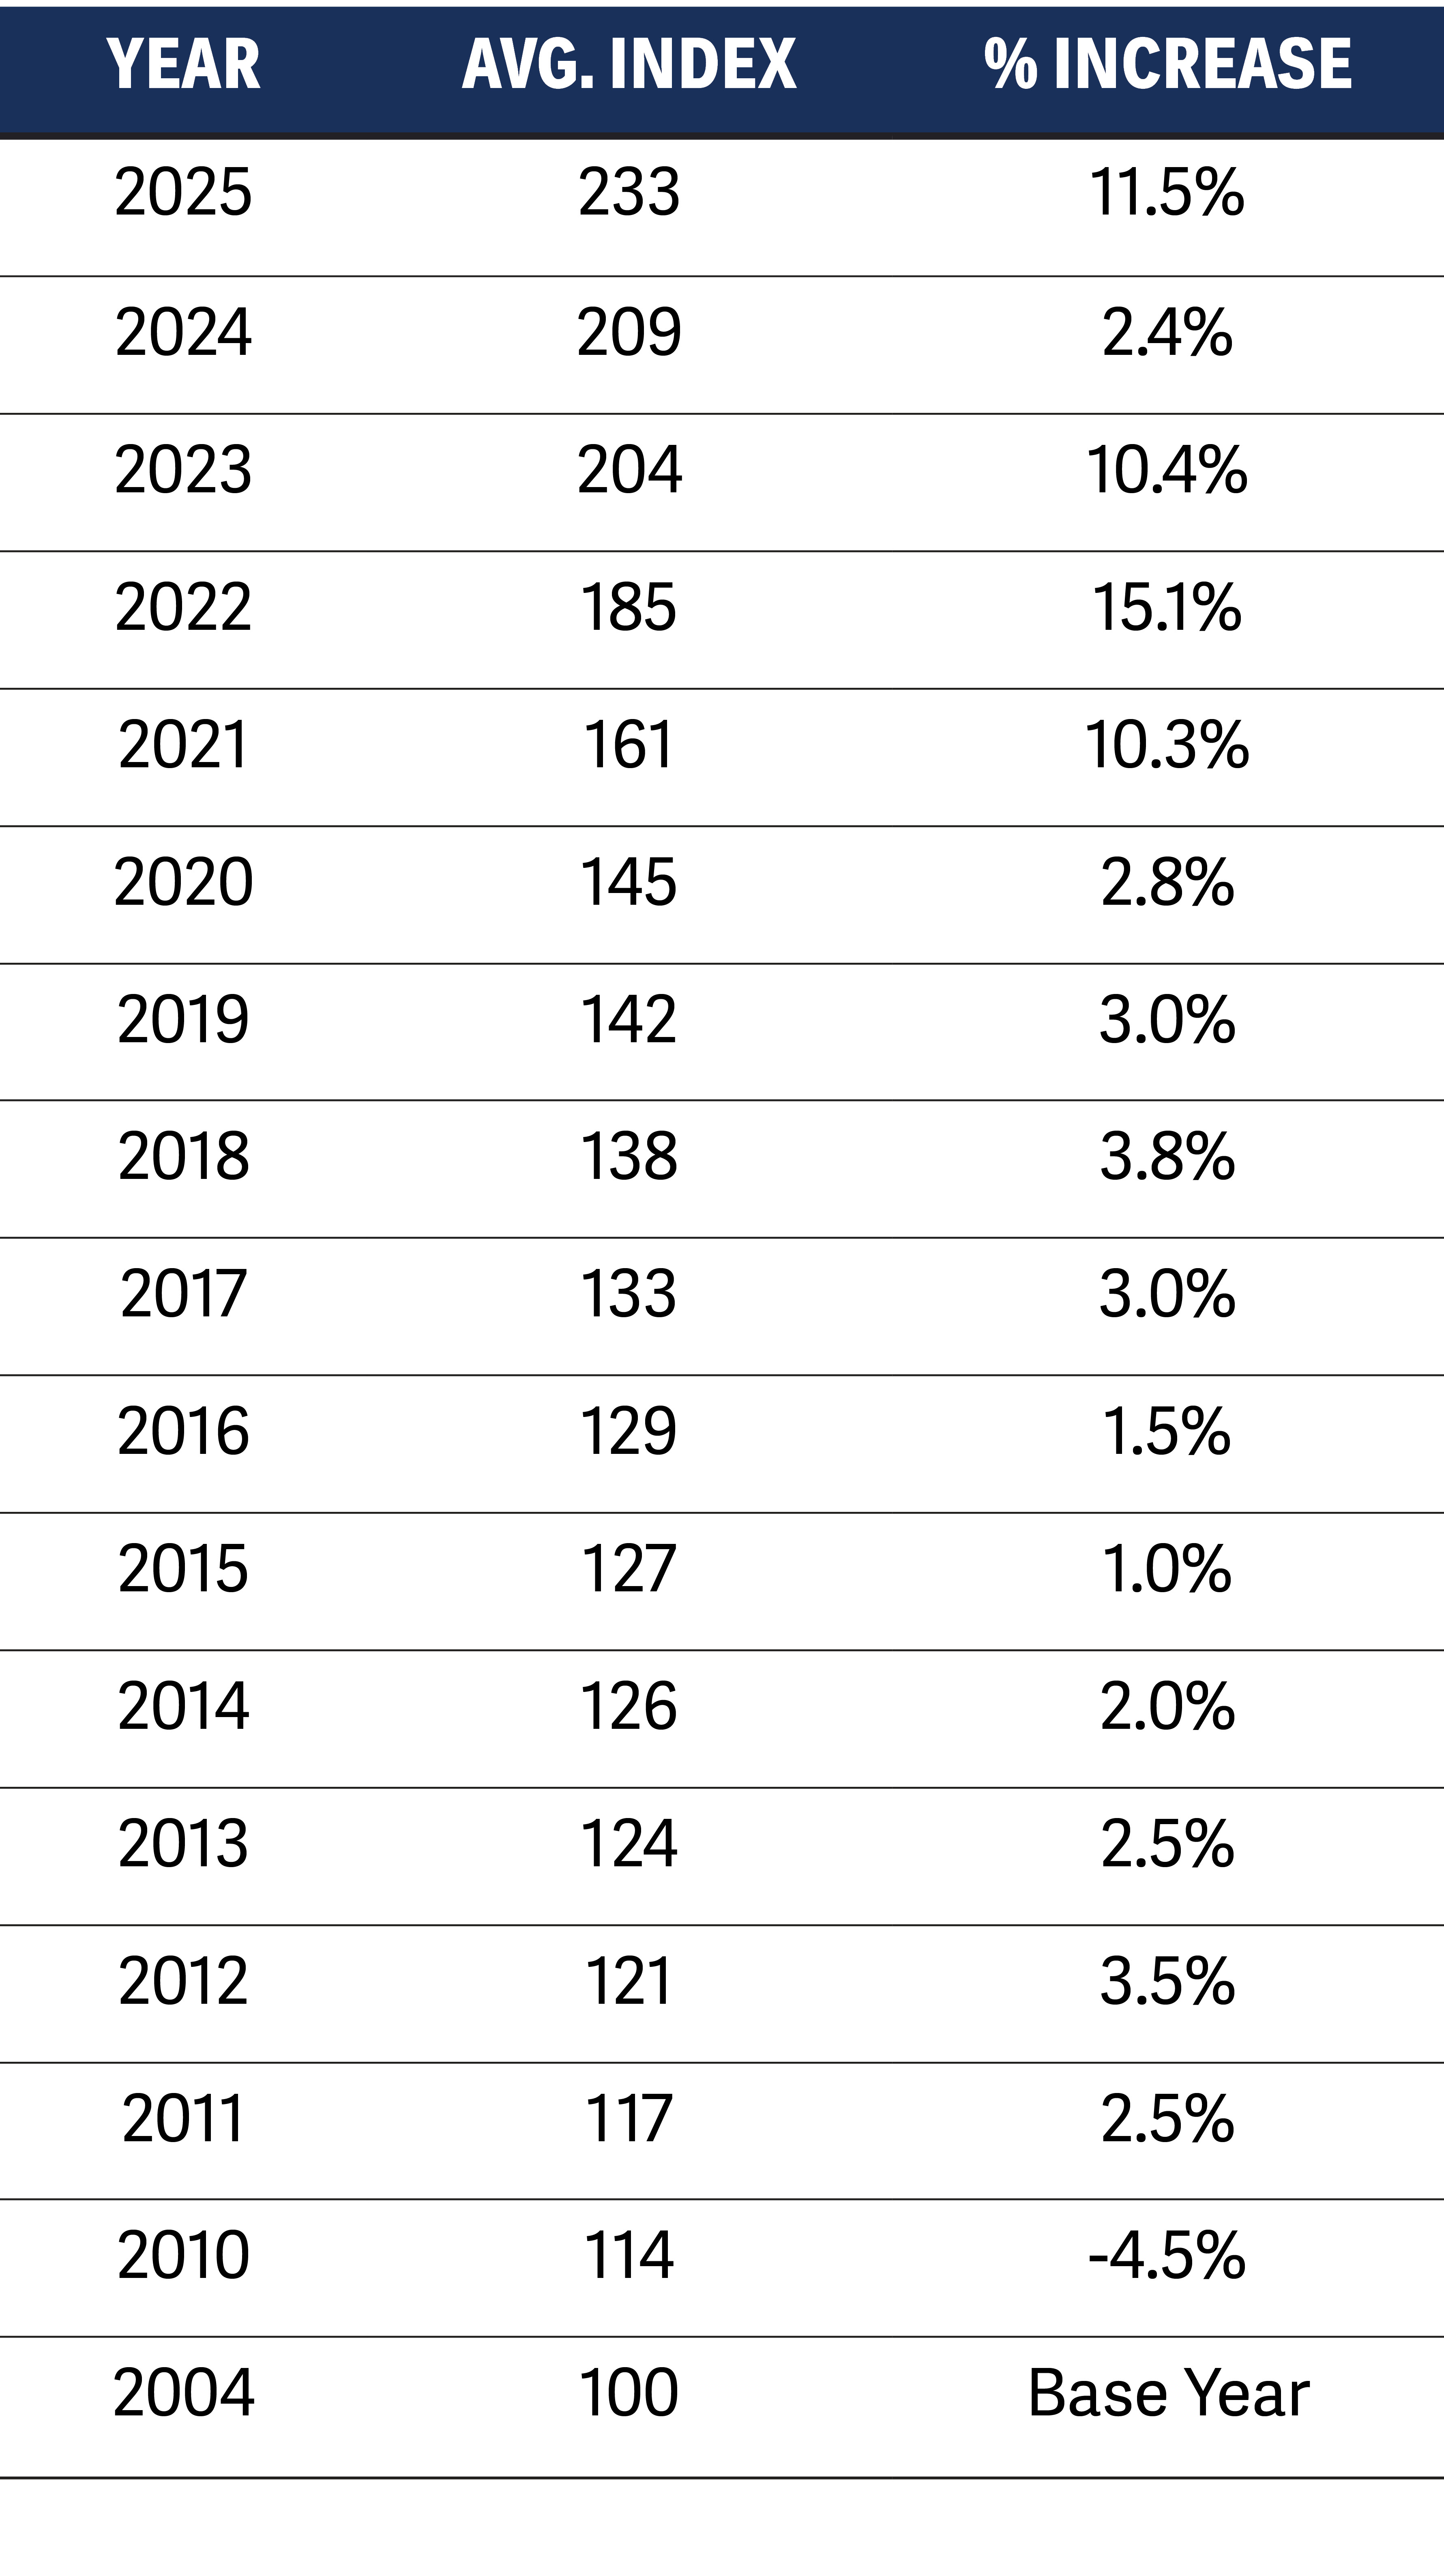
The MEP Cost Index rose to 233 in Q3 2025, continuing its steady upward trend from 227 in Q2. The increase reflects material cost escalation, persistent sector demand, and supply chain volatility from tariffs and shifting logistics.
| Estimated Equipment Lead Times Varies Due to Equipment Sizing |
||
|---|---|---|
| Equipment Type | Previous | Current |
| Cooling Towers | 12-25 weeks | 10-25 weeks |
| Chillers (Air Cooled) | 12-75 weeks | 28-42 weeks |
| Chillers (Water Cooled) | 12-75 weeks | 12-47 weeks |
| AHU | 12-60 weeks | 14-55 weeks |
| Generators | 40-130 weeks | 40-130 weeks |
| Switchgear | 45-70 weeks | 45-80 weeks |
| UPS | 30-42 weeks | 30-42 weeks |
| Lighting Fixtures | 10-16 weeks | 8-16 weeks |
| Lighting Controls | 12-26 weeks | 12-26 weeks |
Major equipment manufacturers are increasing U.S. production to reduce reliance on imports amid rising tariffs and global supply chain risks. This reshoring trend is expected to gradually improve lead times and stabilize pricing through 2026.
New and expanded tariffs on electrical and mechanical components are prompting manufacturers to raise prices, with costs for copper, aluminum, and other materials up 5–10%. Buyers should anticipate mid-cycle price escalations and plan accordingly.
Data Centers and Defense Sustain Market Momentum
AI data center and federal defense projects continue to drive strong demand across the MEP market, keeping production and procurement pipelines active through late Q3 2025.
Equipment Lead Times: Still Long, Still Volatile
Despite improvements in some product categories, critical-path MEP equipment like switchgear and generators continues to face unpredictable lead times and pricing fluctuations due to supply chain realignments and tariff effects.

Average Index History


Do you have a construction project that needs procurement and sourcing expertise? Partner with SourceBlue for exceptional results.