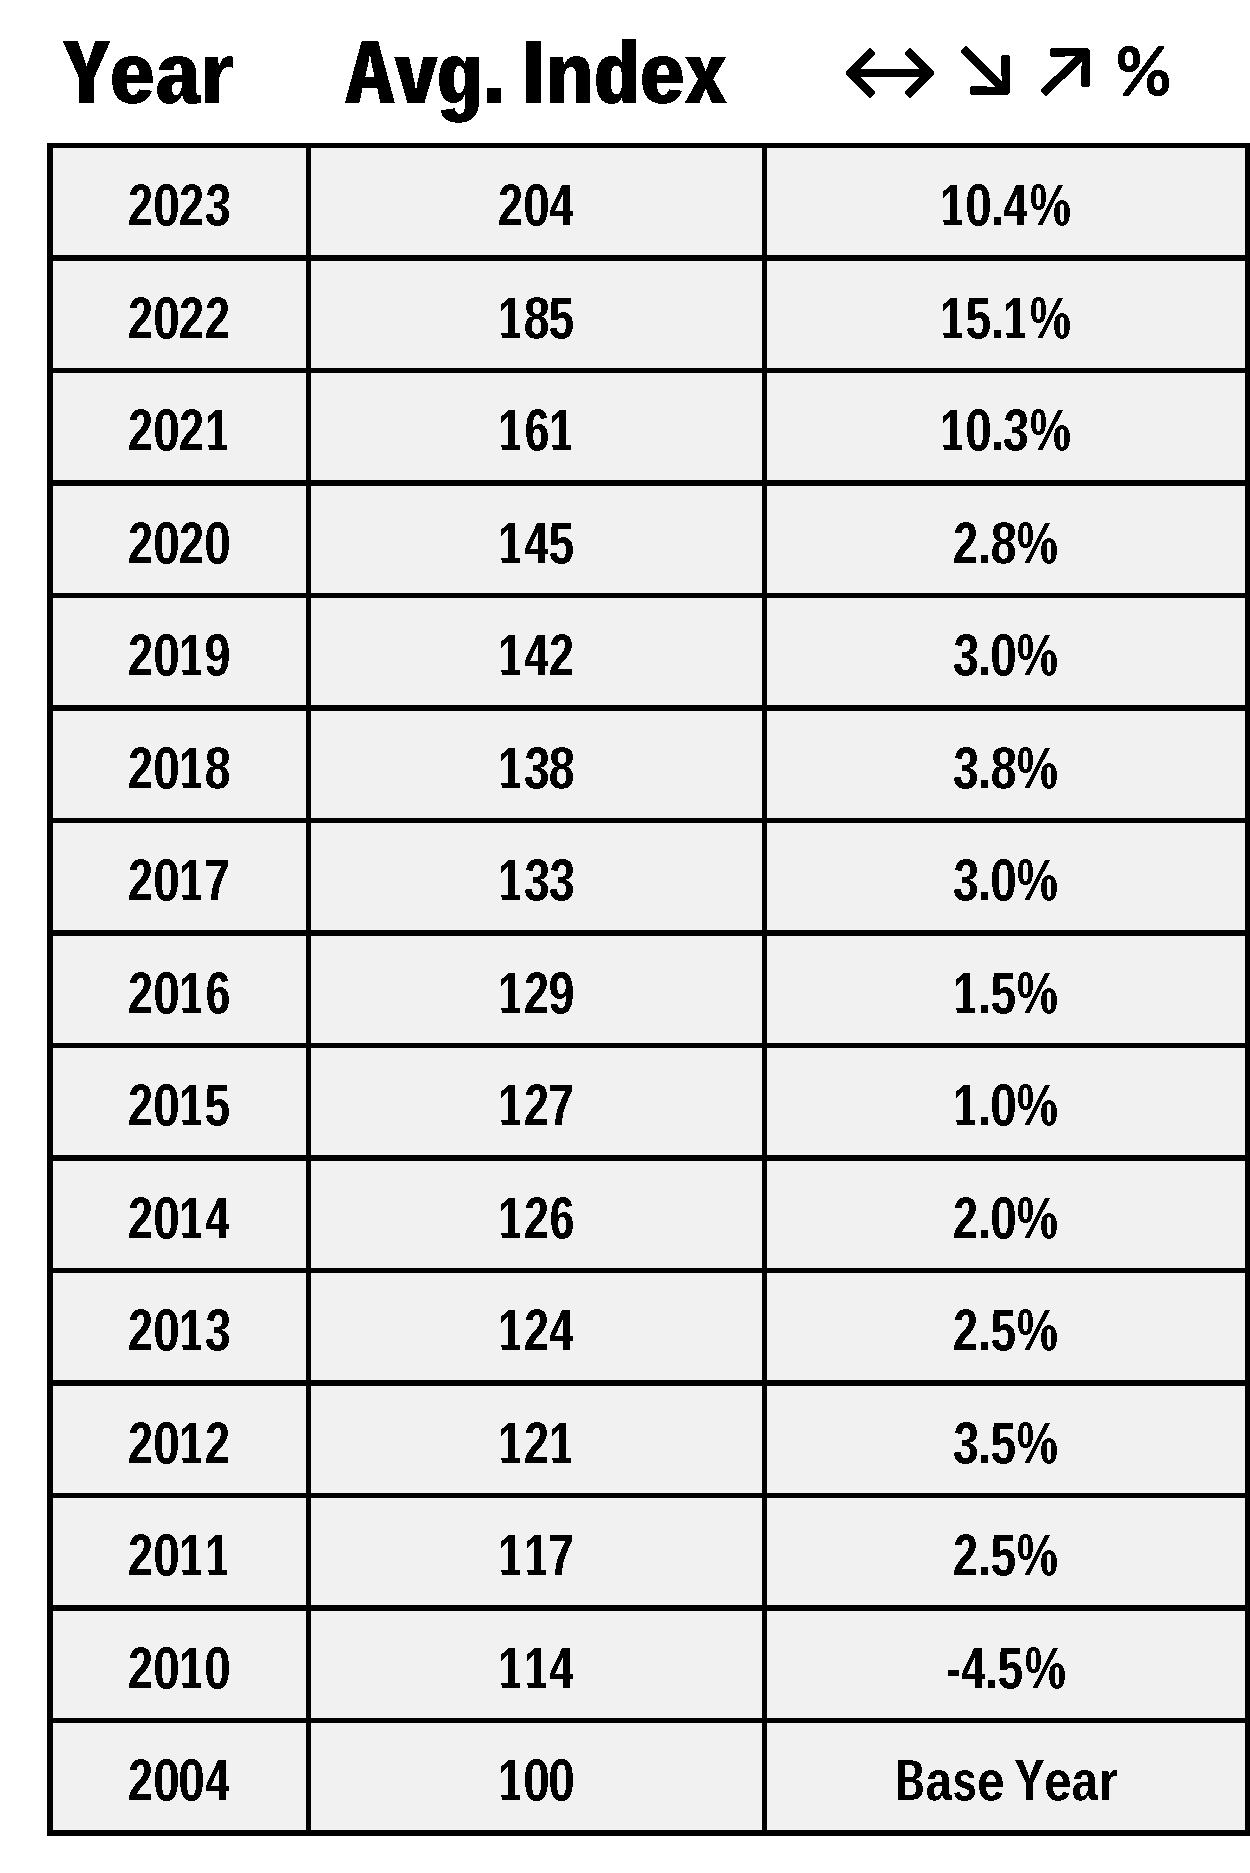
Equipment Cost Index

The ever-increasing complexity and interconnectedness of global markets continue to add new layers of challenges. This makes the mechanical and electrical supply chain a constant hive of adaptation and activity. The continued need for agility comes with its own set of constraints as manufacturers strive to maintain optimal inventory levels and production capacities. Regardless of these efforts, the largest reported challenges continue to be component under stocking.
Manufacturers are increasingly adopting strategies of leaner manufacturing and design, just – in – case inventory management, and improved collaboration with suppliers. A resurgence in research and development for standardization and interchangeability of components between product lines has taken a dominant theme. SourceBlue is engaging with manufacturing partners in demand and capacity planning efforts aiming to reduce lead times and increase schedule certainty
| Estimated Equipment Lead Times Varies Due to Equipment Sizing |
||
|---|---|---|
| Equipment Type | Previous | Current |
| Cooling Towers | 25 - 30 wks | 20 - 30 wks |
| Chillers | 20 - 50 wks | 25 - 55 wks |
| Air Handling Units | 20 - 65 wks | 20 - 55 wks |
| Generators | 45 - 100 wks | 40 - 110 wks |
| Switchgear | 65 - 85 wks | 42 - 85 wks |
| Uninterruptible Power Supply | 30 - 52 wks | 18 - 40 wks |
| Lighting Controls | 16 - 20 wks | 16 - 20 wks |
Electrical manufacturers face challenges due to oversold production (some at nearly 40%) and supply chain issues. Demand for equipment in data centers, semiconductor facilities, and battery plants strains the supply chain, leading to long lead times and higher prices. Some manufacturers expanded capacity, resulting in slight lead-time improvements. However, the demand for backup generators for data centers is exceptionally high.
SourceBlue advises clients to pre-purchase equipment to mitigate the impact of market demand, ensuring better pricing and lead times. Year-to-date industry data for 2023 indicates a 6.6% increase in electrical equipment orders and a 17.5% increase in shipments compared to the same period in 2022. Mechanical equipment orders and shipments also saw positive growth, with a 2.4% increase in orders and a 7.1% increase in shipments.

Average Index History


Do you have a construction project that needs procurement and sourcing expertise? Partner with SourceBlue for exceptional results.