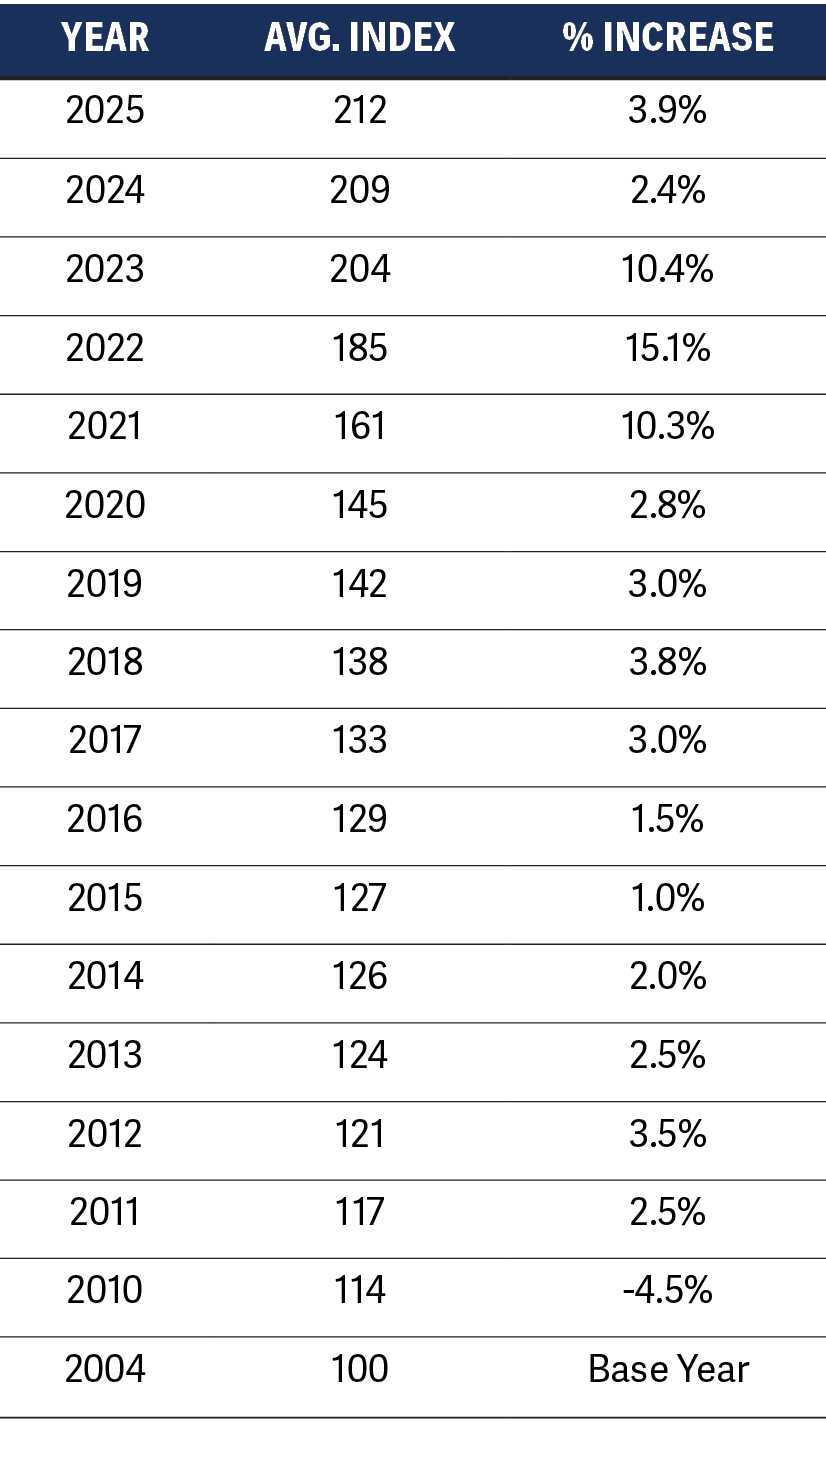
Equipment Cost Index

Year to date industry data for 2025 versus the same time in 2024 shows electrical equipment orders increased (+2.2%) and shipments also increased (+1.0%). For the same timeframe, mechanical equipment orders increased (+19.6%) and shipments increased (+22.5%).
New Technologies: The data center market continues to ramp up with demand and Cooling Distribution Units (CDUs) is the new way to cool high density, heat intensive AI applications. Many vendors not typically in the space have started offering a version of these units. Lead times will increase significantly in the next couple of quarters. Most of the major players are sitting around 25 weeks currently.
| Estimated Equipment Lead Times Varies Due to Equipment Sizing |
||
|---|---|---|
| Equipment Type | Previous | Current |
| Cooling Towers | 14 - 28 wks | 14 - 30 wks |
| Chillers | 20 - 85 wks | 20 - 85 wks |
| AHU | 20 - 50 wks | 16 - 50 wks |
| Generators | 50 - 140 wks | 40 - 130 wks |
| Switchgear | 45 - 90 wks | 45 - 90 wks |
| UPS | 30 - 48 wks | 30 - 42 wks |
| Lighting Fixtures | 10 - 16 wks | 10 - 16 wks |
| Lighting Controls | 12 - 26 wks | 12 - 26 wks |
There have been and will continue to be price increases throughout the industry in part to deal with the current dynamic trade negotiations in the global trade market. Preemptive decisions from suppliers in areas like Europe have started to affect transit times and container prices. We expect this uncertainty to continue for the next couple of quarters.

Average Index History


Do you have a construction project that needs procurement and sourcing expertise? Partner with SourceBlue for exceptional results.